Multiple Choice
Refer to the figure shown.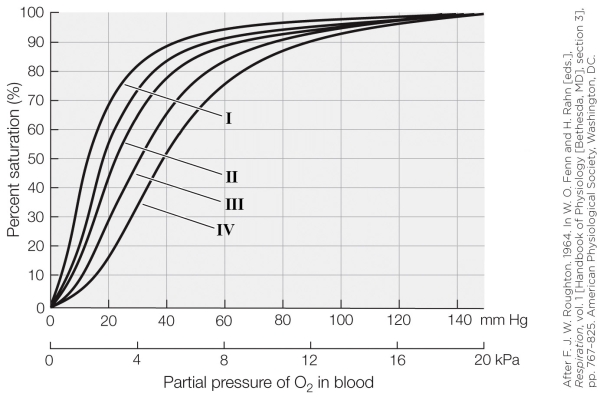 On the graph, which oxygen dissociation curve represents blood with a high CO2 partial pressure (e.g., 80 mm Hg) ?
A) I
B) II
C) III
D) IV
Correct Answer:
Verified
Related Questions
Q14: Refer to the figure shown.![]()

