Refer to the figures.
Figure 1
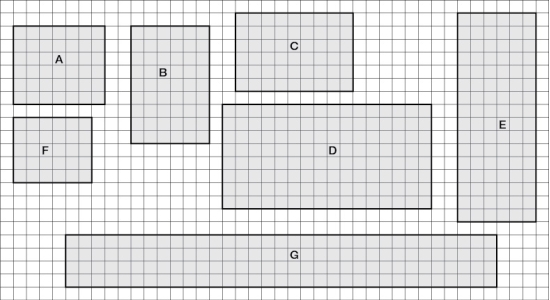 Figure 2
 You are working with a town to develop a conservation strategy for parks (tracts) of protected land in a suburban area (parks A-G). These seven areas are depicted in Figure 1. Each square in the grid indicates an area of 1 km2.
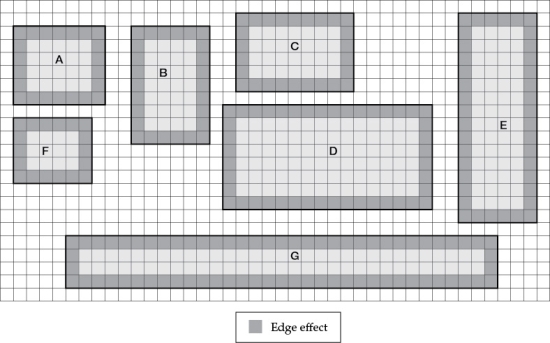
- Refer to Figure 1 to familiarize yourself with the key aspects of the protected areas. Suppose a species of bird lives in the parks in this area. These birds will fly among forest patches, but will only cross a maximum of 3 km of disturbed forest. The forest habitat that the birds require is disturbed by an edge effect that penetrates 1 km into the forest. Suppose for these analyses you assess landscape characteristics for each 1 km2 quadrat. If you decided instead to increase the size of your quadrats to 10 km2, could you change the scale of your analysis with the data you have? Would this be an appropriate scale for a study of the movement preferences of the bird species?
Correct Answer:
Verified
View Answer
Unlock this answer now
Get Access to more Verified Answers free of charge
Q51: Refer to the figure and tables.
Figure 1
Q52: Refer to the figures.
Figure 1

Q53: Refer to the figures.
Figure 1
Q54: Refer to the figures.
Figure 1
Q55: Refer to the figures.
Figure 1
Q57: The landscape of the Amazon rainforest has
Q58: Suppose a two-dimensional landscape image consists of
Q59: Refer to the figure. Q60: In central France, the legacy of Roman Q61: Habitat fragmentation tends to _ the rate![]()
Unlock this Answer For Free Now!
View this answer and more for free by performing one of the following actions

Scan the QR code to install the App and get 2 free unlocks

Unlock quizzes for free by uploading documents