Refer to the figure and tables.
Figure 1
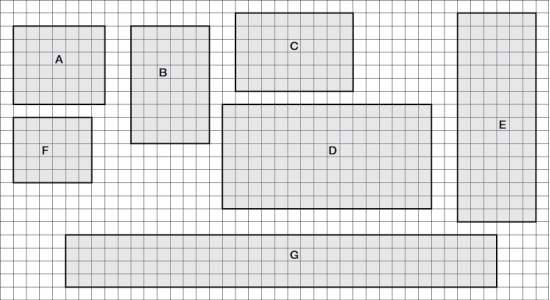
 You are working with a town to develop a conservation strategy for parks (tracts) of protected land in a suburban area (parks A-G). These seven areas are depicted in Figure 1. Each square in the grid indicates an area of 1 km2.
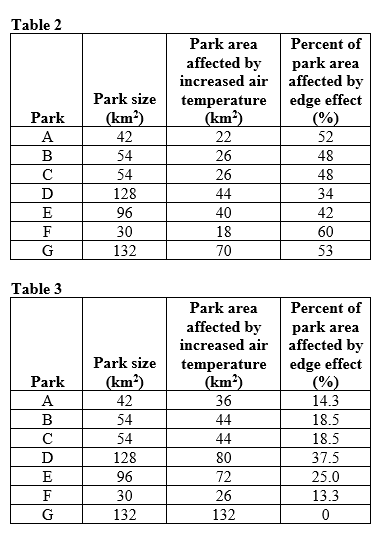
-Refer to Figure 1 to familiarize yourself with the key aspects of the protected areas. Based on the data for edge effects you collected in Tables 2 and 3, are the patterns consistent with the expected impact of edges on parks of different shapes and sizes? What assumptions have you made in this analysis?
Correct Answer:
Verified
View Answer
Unlock this answer now
Get Access to more Verified Answers free of charge
Q46: Refer to the figure. Q47: Refer to the figure. Q48: Refer to the figure. Q49: Refer to the figure. Q50: Refer to the figure. Q52: Refer to the figures. Q53: Refer to the figures. Q54: Refer to the figures. Q55: Refer to the figures. Q56: Refer to the figures.![]()
Figure 1

Figure 1
Figure 1
Figure 1
Figure 1
Figure 1
Figure 1
Figure 1
Figure 1
Unlock this Answer For Free Now!
View this answer and more for free by performing one of the following actions

Scan the QR code to install the App and get 2 free unlocks

Unlock quizzes for free by uploading documents