Refer to the figures.
Figure 1
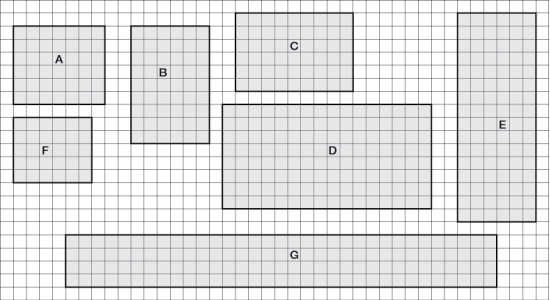 Figure 2
 You are working with a town to develop a conservation strategy for parks (tracts) of protected land in a suburban area (parks A-G). These seven areas are depicted in Figure 1. Each square in the grid indicates an area of 1 km2.
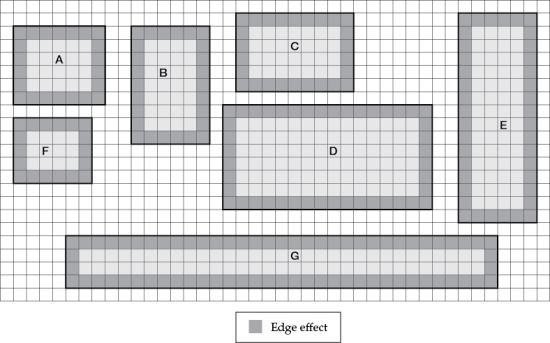
-Refer to Figure 1 to familiarize yourself with the key aspects of the protected areas. Suppose a species of bird lives in the parks in this area. These birds will fly among forest patches, but will only cross a maximum of 3 km of disturbed forest. The forest habitat that the birds require is disturbed by an edge effect that penetrates 1 km into the forest. Based on this information about the birds' movement preferences and the extent of edge effects, which patches could the birds move among? How many isolated populations of this bird species would you expect to find among the parks, and which parks would form each of the newly isolated populations? On Figure 2, circle the isolated populations (this will be referred to as Figure 4).
Correct Answer:
Verified
View Answer
Unlock this answer now
Get Access to more Verified Answers free of charge
Q47: Refer to the figure.
Figure 1

Q48: Refer to the figure.
Figure 1
Q49: Refer to the figure.
Figure 1
Q50: Refer to the figure.
Figure 1
Q51: Refer to the figure and tables.
Figure 1
Q53: Refer to the figures.
Figure 1
Q54: Refer to the figures.
Figure 1
Q55: Refer to the figures.
Figure 1
Q56: Refer to the figures.
Figure 1
Q57: The landscape of the Amazon rainforest has
Unlock this Answer For Free Now!
View this answer and more for free by performing one of the following actions

Scan the QR code to install the App and get 2 free unlocks

Unlock quizzes for free by uploading documents