Refer to the figure.
Figure 1
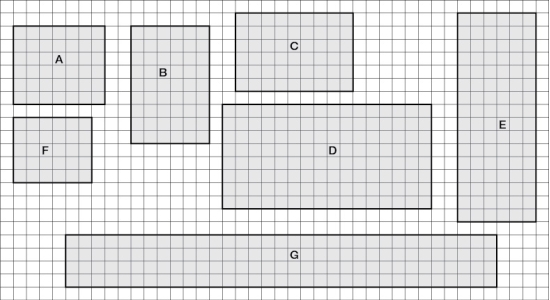 You are working with a town to develop a conservation strategy for parks (tracts) of protected land in a suburban area (parks A-G). These seven areas are depicted in Figure 1. Each square in the grid indicates an area of 1 km2.
-Refer to Figure 1 to familiarize yourself with the key aspects of the protected areas and answer the following questions:
a) Determine the overall size of each park (in km2) and create a table of these data (this will be referred to as Table 1).
b) Based on the total area, what percent of the available land is currently protected?
c) Based solely on the size of each park, which park would you expect to have the highest species richness? Why?
d) Based solely on size and shape of each park, which park would you expect would have the most potential for preserving viable populations of a threatened species? Why?
Correct Answer:
Verified
c) Park G
d) Par...
View Answer
Unlock this answer now
Get Access to more Verified Answers free of charge
Q42: Which statement about the role of humans
Q43: Refer to the figure. Q44: The recovery of the wolf in the Q45: Which change did not occur after wolves![]()

Unlock this Answer For Free Now!
View this answer and more for free by performing one of the following actions

Scan the QR code to install the App and get 2 free unlocks

Unlock quizzes for free by uploading documents