Refer to the figure.
Figure 1
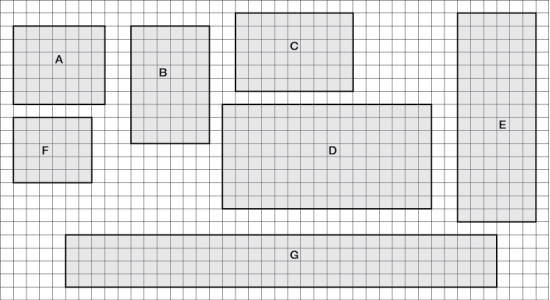 You are working with a town to develop a conservation strategy for parks (tracts) of protected land in a suburban area (parks A-G). These seven areas are depicted in Figure 1. Each square in the grid indicates an area of 1 km2.
-Refer to Figure 1 to familiarize yourself with the key aspects of the protected areas. Suppose the parks are susceptible to edge effects in the form of increased tree mortality and that this edge effect penetrates 2 km into the parks. Areas of the park that are more than 2 km from an edge are unaffected, and tree mortality does not increase in those areas.Answer the following questions:
a) Using Figure 1, create a new figure (this will be referred to as Figure 3) indicating the areas of the parks that would be affected by the edge effect of increased tree mortality.
b) Summarize how this edge effect would affect each of the parks (A-G) by creating a new table (this will be referred to as Table 3). Based on the size (km2) of each park and the edge effects you sketched in for Figure 3, determine how much area within each park would be affected by increased tree mortality (in km2). Based on the total area of each park and the area that would be affected by edge effects, determine the area of each park (in %) that would not be affected by edge effects.
c) In which park would the most land area (in km2) be affected by the increased tree mortality? In which park would the least land area be affected by increased tree mortality (km2)? Which park would have the lowest percent unaffected area? Which park would have the highest percent unaffected area?
Correct Answer:
Verified
Figure 3
View Answer
Unlock this answer now
Get Access to more Verified Answers free of charge

Unlock this Answer For Free Now!
View this answer and more for free by performing one of the following actions

Scan the QR code to install the App and get 2 free unlocks

Unlock quizzes for free by uploading documents