Refer to the figure.
Figure 1
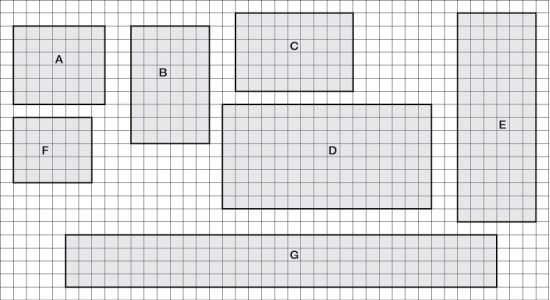 You are working with a town to develop a conservation strategy for parks (tracts) of protected land in a suburban area (parks A-G). These seven areas are depicted in Figure 1. Each square in the grid indicates an area of 1 km2.
-Refer to Figure 1 to familiarize yourself with the key aspects of the protected areas. Based on how forests in the park respond to edge effects, do you think that increased temperature alone could explain the biotic response (tree mortality) to edges seen in these examples? Why or why not?
Correct Answer:
Verified
View Answer
Unlock this answer now
Get Access to more Verified Answers free of charge
Q45: Which change did not occur after wolves
Q46: Refer to the figure. Q47: Refer to the figure. Q48: Refer to the figure. Q49: Refer to the figure. Q51: Refer to the figure and tables. Q52: Refer to the figures. Q53: Refer to the figures. Q54: Refer to the figures. Q55: Refer to the figures.![]()
Figure 1

Figure 1
Figure 1
Figure 1
Figure 1
Figure 1
Figure 1
Figure 1
Unlock this Answer For Free Now!
View this answer and more for free by performing one of the following actions

Scan the QR code to install the App and get 2 free unlocks

Unlock quizzes for free by uploading documents