Refer to the figure.
Figure 3
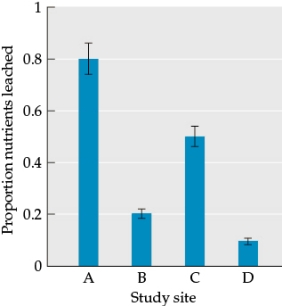 Suppose you are now studying soils that vary in the amount of leaching they have undergone. You sample the proportion of nutrients leached from the top soil horizon. Your data are graphed in Figure 3.Answer the following questions:
a) Which study site is likely to have soil with low nutrient levels?
b) Which study site is likely to have soil with high nutrient levels?
c) Which study site likely has the oldest soil? Why? What factors would have to be similar among the sites in order to determine soil age from the data given?
Correct Answer:
Verified
View Answer
Unlock this answer now
Get Access to more Verified Answers free of charge
Q56: Refer to the table and the figure.
Table
Q57: Refer to the table and the figure.
Table
Q58: Refer to the table and the figure.
Table
Q59: Refer to the table and the figure.
Table
Q60: Refer to the table and the figure.
Table
Q62: Which of the following statements about nutrient
Q63: All nutrients are ultimately derived from
A) minerals
Q64: Which of the following does not influence
Q65: In order for most organisms to use
Q66: _ is the key process by which
Unlock this Answer For Free Now!
View this answer and more for free by performing one of the following actions

Scan the QR code to install the App and get 2 free unlocks

Unlock quizzes for free by uploading documents