Refer to the table and the figure.
Table 1
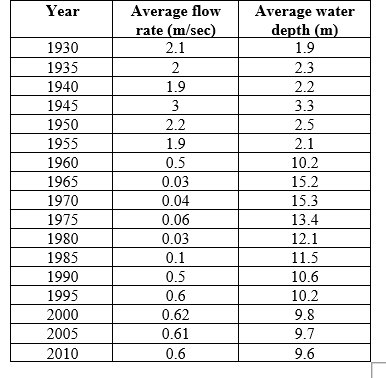 Figure 2
 You are studying a river that has been dammed to form a reservoir. You have compiled data collected on this system over time (Table 1 and Figure 2).
-Use the data in Table 1 and Figure 2 to answer the following questions about the effect of changes in water depth on the nutrient status of the reservoir:
a) How did the average water depth change between 1970 and 1985? How can you explain this change in water depth?
b) How do you think this change in water depth affected the nutrient status of the reservoir?
Correct Answer:
Verified
View Answer
Unlock this answer now
Get Access to more Verified Answers free of charge
Q53: Refer to the figure.
Figure 1

Q54: Refer to the figure.
Figure 1
Q55: Refer to the figure.
Figure 1
Q56: Refer to the table and the figure.
Table
Q57: Refer to the table and the figure.
Table
Q59: Refer to the table and the figure.
Table
Q60: Refer to the table and the figure.
Table
Q61: Refer to the figure.
Figure 3
Q62: Which of the following statements about nutrient
Q63: All nutrients are ultimately derived from
A) minerals
Unlock this Answer For Free Now!
View this answer and more for free by performing one of the following actions

Scan the QR code to install the App and get 2 free unlocks

Unlock quizzes for free by uploading documents