Refer to the table and the figure.
Table 1
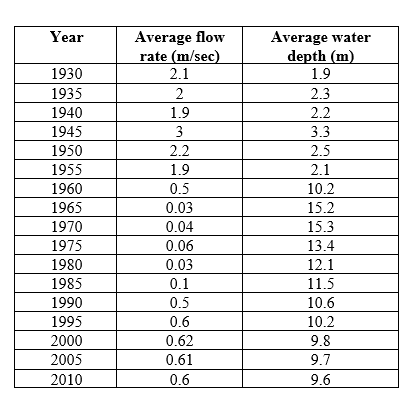 Figure 2
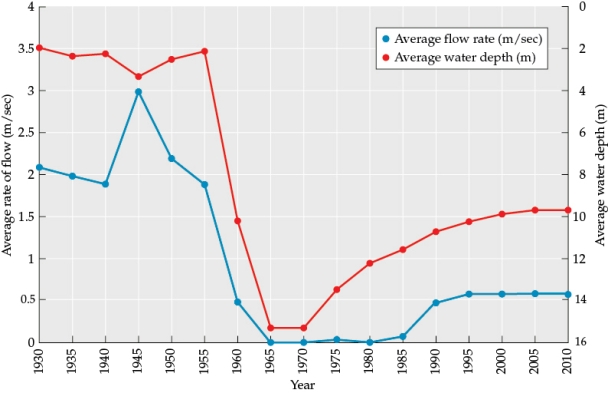 You are studying a river that has been dammed to form a reservoir. You have compiled data collected on this system over time (Table 1 and Figure 2).
-Use your knowledge of nutrient cycles in aquatic systems and the data in Table 1 and Figure 2 to report summary data for this new system.
a) Between which two sample years did dam construction begin? How did you deduce this?
b) Prior to dam construction, what was the natural average flow rate of the river (round to one decimal place)?
c) Prior to dam construction, what was the natural average water depth of the river (round to one decimal place)?
d) By which year had the reservoir likely filled to capacity?
Correct Answer:
Verified
View Answer
Unlock this answer now
Get Access to more Verified Answers free of charge
Q51: Refer to the figure.
Figure 1

Q52: Refer to the figure.
Figure 1
Q53: Refer to the figure.
Figure 1
Q54: Refer to the figure.
Figure 1
Q55: Refer to the figure.
Figure 1
Q57: Refer to the table and the figure.
Table
Q58: Refer to the table and the figure.
Table
Q59: Refer to the table and the figure.
Table
Q60: Refer to the table and the figure.
Table
Q61: Refer to the figure.
Figure 3
Unlock this Answer For Free Now!
View this answer and more for free by performing one of the following actions

Scan the QR code to install the App and get 2 free unlocks

Unlock quizzes for free by uploading documents