Refer to the table and figure.
Table 2
 Figure 4
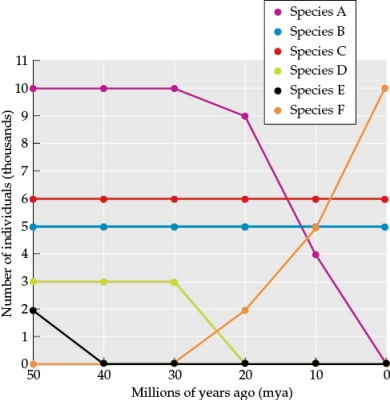 You are studying the long-term effects of plate movement for two land masses, land mass A and land mass B. Your goal is to understand how land mass movement has affected the species found on each land mass. Land mass B joined with land mass A 30 million years ago. Table 2 shows the number of individuals of each species (species A-F) found living on land mass B over time. Figure 4 shows these data plotted.
-Use the data in Table 2 and Figure 4 to answer the following questions:
a) Sketch a vertical line on Figure 4 to indicate the time when land masses A and B joined (this will be referred to as Figure 5).
b) Which species on land mass B became extinct before land masses A and B joined?
c) Which species on land mass B became extinct after land masses A and B joined?
d) Which species was not originally found on land mass B but could have dispersed there from land mass A following the joining of the two land masses?
e) Which species showed no change in the number of individuals as a result of the joining of the two land masses?
Correct Answer:
Verified
Figure 5
View Answer
Unlock this answer now
Get Access to more Verified Answers free of charge
Q48: Refer to the figure.
Figure 2

Q49: Refer to the figure.
Figure 3
Q50: Refer to the figure.
Figure 3
Q51: Refer to the figure.
Figure 3
Q52: Refer to the figure.
Figure 3
Q54: Refer to the table and the figure.
Table
Q55: Refer to the table and figure.
Table 2
Q56: Which statement about regional scale is true?
A)
Q57: Across various sites within the rainforest of
Q58: Witman's studies of marine invertebrate communities demonstrated
Unlock this Answer For Free Now!
View this answer and more for free by performing one of the following actions

Scan the QR code to install the App and get 2 free unlocks

Unlock quizzes for free by uploading documents