Refer to the table and figure.
Table 2
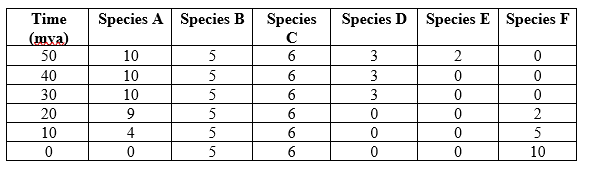 Figure 4
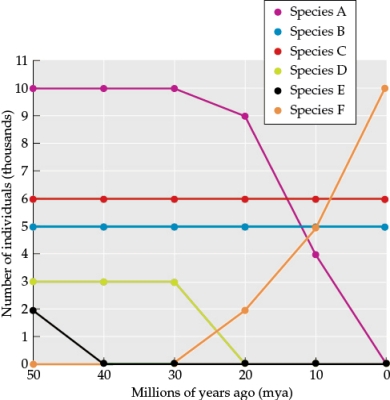 You are studying the long-term effects of plate movement for two land masses, land mass A and land mass B. Your goal is to understand how land mass movement has affected the species found on each land mass. Land mass B joined with land mass A 30 million years ago. Table 2 shows the number of individuals of each species (species A-F) found living on land mass B over time. Figure 4 shows these data plotted.
- Suppose land mass A has a land area five times greater than the area of land mass B. Based on the species-area relationship, do you expect that species richness will be higher or lower on land mass A compared to land mass B? Why?
Correct Answer:
Verified
View Answer
Unlock this answer now
Get Access to more Verified Answers free of charge
Q50: Refer to the figure.
Figure 3

Q51: Refer to the figure.
Figure 3
Q52: Refer to the figure.
Figure 3
Q53: Refer to the table and figure.
Table 2
Q54: Refer to the table and the figure.
Table
Q56: Which statement about regional scale is true?
A)
Q57: Across various sites within the rainforest of
Q58: Witman's studies of marine invertebrate communities demonstrated
Q59: Which of the following is not a
Q60: Which present-day continent was not part of
Unlock this Answer For Free Now!
View this answer and more for free by performing one of the following actions

Scan the QR code to install the App and get 2 free unlocks

Unlock quizzes for free by uploading documents