Refer to the table and the figure.
Table 2
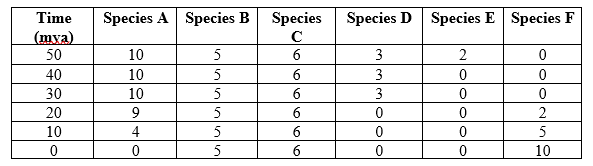 Figure 4
 You are studying the long-term effects of plate movement for two land masses, land mass A and land mass B. Your goal is to understand how land mass movement has affected the species found on each land mass. Land mass B joined with land mass A 30 million years ago. Table 2 shows the number of individuals of each species (species A-F) found living on land mass B over time. Figure 4 shows these data plotted.
- Use the data in Table 2 and Figure 4 to answer the following questions:
a) Create a line graph of the species richness of land mass B over time (this will be referred to as Figure 6). The x-axis should be time in mya, ranging from 50-0 mya, and the y-axis should be species richness, ranging from 0-6.
b) What was the overall effect of the joining of land masses A and B on the species richness of land mass B?
c) Describe the similarities and differences in the patterns of change in species richness and composition through time.
Correct Answer:
Verified
Figure 6
View Answer
Unlock this answer now
Get Access to more Verified Answers free of charge
Q49: Refer to the figure.
Figure 3

Q50: Refer to the figure.
Figure 3
Q51: Refer to the figure.
Figure 3
Q52: Refer to the figure.
Figure 3
Q53: Refer to the table and figure.
Table 2
Q55: Refer to the table and figure.
Table 2
Q56: Which statement about regional scale is true?
A)
Q57: Across various sites within the rainforest of
Q58: Witman's studies of marine invertebrate communities demonstrated
Q59: Which of the following is not a
Unlock this Answer For Free Now!
View this answer and more for free by performing one of the following actions

Scan the QR code to install the App and get 2 free unlocks

Unlock quizzes for free by uploading documents