Refer to the figure.
Figure 1
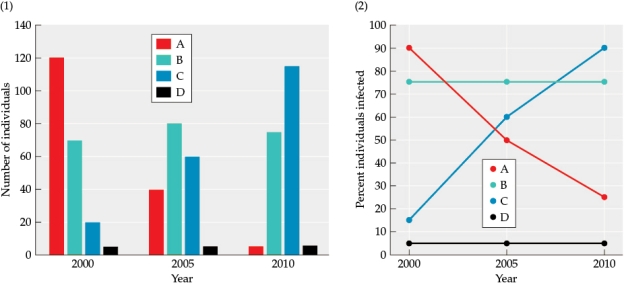 The figure shows data collected on a species of fish that lives on a coral reef. The fish were captured and studied three times-in 2000, 2005, and 2010. Four genotypes were found in an area of the coral reef (shown as A, B, C, and D). The figure shows: (1) the number of individuals of each genotype captured during each year, and (2) the percent of individuals infected with parasites captured during each year.
-Answer the following questions:
a) How does population size change over time for each of the four genotypes?
b) How does the percent of infected individuals change over time for each of the four genotypes?
c) Based on the percent of infected individuals of each genotype in each year, calculate the numbers of infected individuals. Create a new graph (this will be referred to as Figure 2) that reflects this data using the Figure 1 left, with each column reflecting a height that indicates the number of infected individuals.
d) What is the average infection rate across all genotypes for each study year? Create another new graph (this will be referred to as Figure 3) that reflects this data using Figure 1 right. Use an asterisk (*) to indicate the average infection rate for each year. Next, calculate the average of the average infection rate and add this data to the graph as a horizontal dotted line
Correct Answer:
Verified
View Answer
Unlock this answer now
Get Access to more Verified Answers free of charge
Q47: Refer to the figure. Q48: Humans have a long history of association Q49: A flowering plant species and a honeycreeper Q50: You are studying a population of a Q51: Two parasites are found in a population Q53: Refer to the figure. Q54: Refer to the figure. Q55: Two populations (population 1 and population 2) Q56: Suppose you are studying disease transmission in Q57: Refer to the figure.![]()
Figure 1

Figure 1
![]()
Unlock this Answer For Free Now!
View this answer and more for free by performing one of the following actions

Scan the QR code to install the App and get 2 free unlocks

Unlock quizzes for free by uploading documents