Refer to the figure.
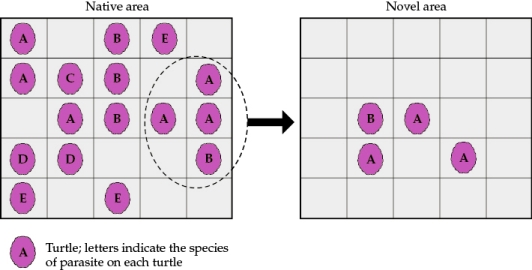 Suppose a turtle population is started from four individuals that disperse to a novel area. The figure shows the locations of each turtle in the native and novel areas and the type of parasites it carries. Each cell on the grid measures 1 m * 1 m. For this example, assume that each individual turtle can carry only one species of parasite at a time, and each individual carries a population of 100 individual parasites. The dashed circle and arrow indicate four individuals that moved to the novel area.Answer the following questions:
a) What effect did the founding of this novel turtle population have on the turtle's parasites? How did the total number of parasite species change during the move from the native to the novel area?
b) How would you expect turtle survival and growth rates in the novel area to be different from those in the native area if the presence of parasites has a negative effect on survival and growth rate?
Correct Answer:
Verified
View Answer
Unlock this answer now
Get Access to more Verified Answers free of charge
Q52: Refer to the figure.
Figure 1

Q53: Refer to the figure.
Figure 1
Q54: Refer to the figure.
Figure 1
Q55: Two populations (population 1 and population 2)
Q56: Suppose you are studying disease transmission in
Q58: Which parasite alters the behavior of rats,
Q59: Which characteristic best distinguishes microparasites from macroparasites?
A)
Q60: Which statement about mistletoe is false?
A) It
Q61: Evolution in a parasite from ectoparasitism to
Q62: Which characteristic is an advantage that ectoparasites
Unlock this Answer For Free Now!
View this answer and more for free by performing one of the following actions

Scan the QR code to install the App and get 2 free unlocks

Unlock quizzes for free by uploading documents