Refer to the figure.
Figure 1
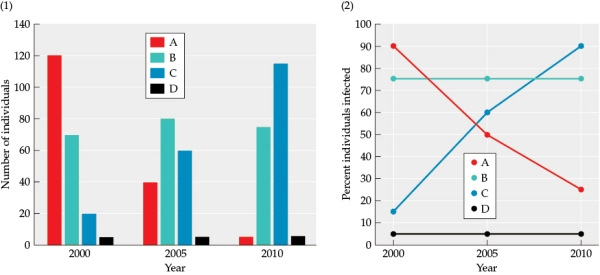 The figure shows data collected on a species of fish that lives on a coral reef. The fish were captured and studied three times-in 2000, 2005, and 2010. Four genotypes were found in an area of the coral reef (shown as A, B, C, and D). The figure shows: (1) the number of individuals of each genotype captured during each year, and (2) the percent of individuals infected with parasites captured during each year.
-Answer the following questions:
a) Graph the relationship between the numbers of individuals of different genotypes and
the percent of infected individuals (this will be referred to as Figure 4). Refer to data on population size and percent of individuals infected by genotype. For simplicity, graph all of the data from all of the years on the same plot as points on a scatter graph. Sketch a line that fits the relationship between population size and percent infected.
b) What does this data tell you about the likely relationship between genotype, numbers of individuals, and the percent infected individuals?
Correct Answer:
Verified
Figure 4
View Answer
Unlock this answer now
Get Access to more Verified Answers free of charge
Q48: Humans have a long history of association
Q49: A flowering plant species and a honeycreeper
Q50: You are studying a population of a
Q51: Two parasites are found in a population
Q52: Refer to the figure.
Figure 1

Q54: Refer to the figure.
Figure 1
Q55: Two populations (population 1 and population 2)
Q56: Suppose you are studying disease transmission in
Q57: Refer to the figure. Q58: Which parasite alters the behavior of rats,
![]()
Unlock this Answer For Free Now!
View this answer and more for free by performing one of the following actions

Scan the QR code to install the App and get 2 free unlocks

Unlock quizzes for free by uploading documents