(Figure) The figure shows the cost curves for a representative firm. At an output level of 5 units, the average fixed, variable, and average total costs, respectively, would be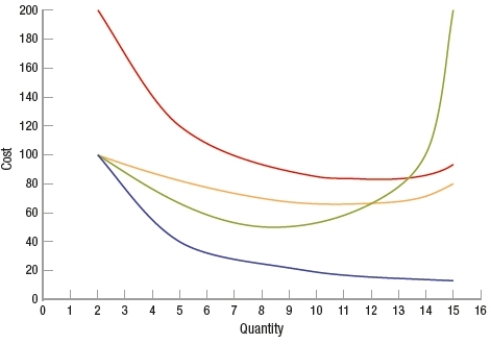
A) $120; $66.67; $186.67
B) $40; $80; $120
C) $66.67; $53.33; $120
D) $100; $120; $220
Correct Answer:
Verified
Q182: When the Stay Connected Cell Phone Company
Q183: When the Frame Factory is producing 1,500
Q184: Calvin is a college student who identified
Q185: (Understanding Cost Curves) The curve in the
Q186: (Figure: Understanding Cost Curves 2) Match the
Q188: Which curve is NOT U-shaped?
A) average variable
Q189: As output increases, average total cost and
Q190: A lumber company that specializes in making
Q191: (Figure: Determining Long-Run Costs) Given the information
Q192: (Figure: Interpreting the LRATC) Which region(s) in
Unlock this Answer For Free Now!
View this answer and more for free by performing one of the following actions

Scan the QR code to install the App and get 2 free unlocks

Unlock quizzes for free by uploading documents