(Figure: Interpreting the LRATC) Which region(s) in the graph indicate(s) diseconomies of scale?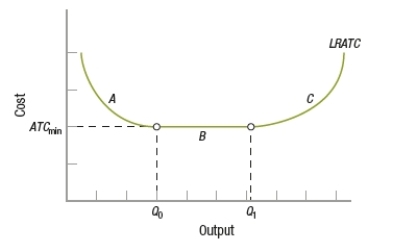
A) A
B) B
C) C
D) B and C
Correct Answer:
Verified
Q187: (Figure) The figure shows the cost curves
Q188: Which curve is NOT U-shaped?
A) average variable
Q189: As output increases, average total cost and
Q190: A lumber company that specializes in making
Q191: (Figure: Determining Long-Run Costs) Given the information
Q193: (Figure: Interpreting the LRATC) In which region(s)
Q194: Economies of scale
A) only occur in the
Q195: A firm experiences _ over the range
Q196: If a firm increases its inputs by
Q197: It can be cost-effective to pursue economies
Unlock this Answer For Free Now!
View this answer and more for free by performing one of the following actions

Scan the QR code to install the App and get 2 free unlocks

Unlock quizzes for free by uploading documents