(Figure: Determining Long-Run Costs) Given the information in the graph, which curve would represent this profit-maximizing firm's average cost curve if it were to produce 0.4 unit of output?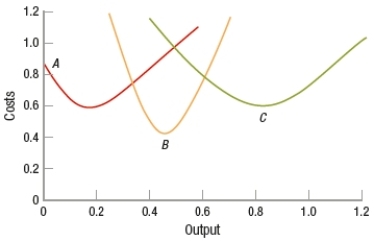
A) A
B) B
C) C
D) A or B, depending on the industry
Correct Answer:
Verified
Q186: (Figure: Understanding Cost Curves 2) Match the
Q187: (Figure) The figure shows the cost curves
Q188: Which curve is NOT U-shaped?
A) average variable
Q189: As output increases, average total cost and
Q190: A lumber company that specializes in making
Q192: (Figure: Interpreting the LRATC) Which region(s) in
Q193: (Figure: Interpreting the LRATC) In which region(s)
Q194: Economies of scale
A) only occur in the
Q195: A firm experiences _ over the range
Q196: If a firm increases its inputs by
Unlock this Answer For Free Now!
View this answer and more for free by performing one of the following actions

Scan the QR code to install the App and get 2 free unlocks

Unlock quizzes for free by uploading documents