Dr. Green conducted an ANCOVA to determine whether hearing-impaired children who were taught sign language early on would develop better language skills compared to those who did not learn sign language. The data set contains two independent random samples (children who learned sign language and those who did not) of paired values on the covariate (X; child's hearing) and the dependent variable (Y; language skills measured when the child was three years old). Dr. Green also examined the data to see if the assumptions of ANCOVA were met. The following table and figures are the selected output from Dr. Green's analysis ( = .05):
Tests of Between-Subjects Effects
Dependent Variable: Language
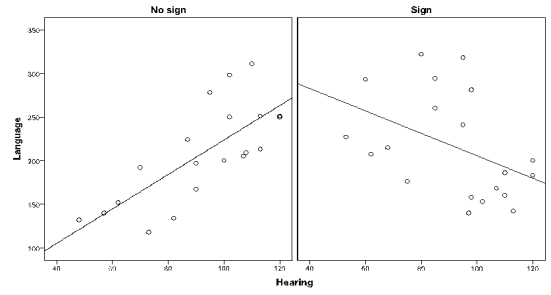
a. What assumption is being evaluated here?
b. Was this assumption satisfied? If not, what effect might it have on the results of ANCOVA?
Correct Answer:
Verified
View Answer
Unlock this answer now
Get Access to more Verified Answers free of charge
Q1: A researcher wanted to examine if
Q2: A market researcher wanted to know
Q3: Mike wanted to examine whether people
Q4: Barbara wants to know whether students
Q6: For which of the following situations is
Q7: Suppose the researcher used IQ as the
Q8: Suppose out of budget concerns, the researcher
Q9: A researcher wanted to examine if soil
Q10: A researcher wanted to examine if soil
Q11: A researcher wanted to examine if soil
Unlock this Answer For Free Now!
View this answer and more for free by performing one of the following actions

Scan the QR code to install the App and get 2 free unlocks

Unlock quizzes for free by uploading documents