A sample of 55 streams in severe distress was obtained during 2007. The following bar graph illustrates the number of streams that are from the Northeast, Northwest, Southeast, or Southwest. In the bar graph, the bar for the Northeast has been omitted.
Which of the following statements is correct about these data?
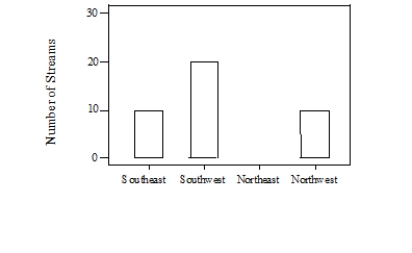
A) A time plot of the 2007 distribution would be more informative.
B) The bar graph is skewed to the right.
C) The bar graph is skewed to the left.
D) It would be correct to make a pie chart if you included the Northeast category.
Correct Answer:
Verified
Q14: What is important to do when drawing
Q15: For a biology lab course containing
Q16: For a biology lab course containing
Q17: A sample of 55 streams in severe
Q18: A sample of 55 streams in severe
Q20: The following table shows the percent
Q21: The following graph shows the percent of
Q22: The following graph shows the percent of
Q23: The estimated annual number of smoking-attributable
Q24: The estimated annual number of smoking-attributable
Unlock this Answer For Free Now!
View this answer and more for free by performing one of the following actions

Scan the QR code to install the App and get 2 free unlocks

Unlock quizzes for free by uploading documents