The figure shows inflation from 2009 to 2018 for countries in the Organization for Economic Cooperation and Development (OECD) . The country with the second-highest inflation rate was: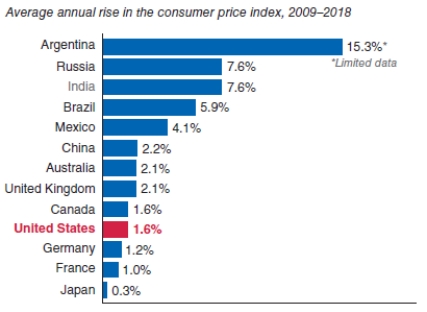
A) Switzerland.
B) Argentina.
C) Russia.
D) Italy.
Correct Answer:
Verified
Q27: If managers expect the inflation rate to
Q28: If managers expect inflation to approach the
Q29: If managers use strong macroeconomic knowledge and
Q30: The figure shows inflation from 2009 to
Q31: The figure shows inflation from 2009 to
Q33: The figure shows inflation expectations for U.S.
Q34: The figure shows inflation expectations and actual
Q35: When output exceeds potential output:
(i) there is
Q36: When output is less than potential output:
(i)
Q37: If expected inflation is 3% and actual
Unlock this Answer For Free Now!
View this answer and more for free by performing one of the following actions

Scan the QR code to install the App and get 2 free unlocks

Unlock quizzes for free by uploading documents