The figure shows inflation expectations for U.S. consumers over time. In which time period did consumers expect the highest inflation rates?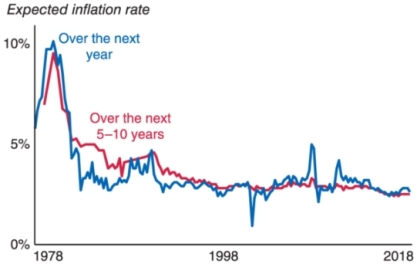
A) late 1990s
B) early 1990s
C) late 1970s
D) early 2000s
Correct Answer:
Verified
Q28: If managers expect inflation to approach the
Q29: If managers use strong macroeconomic knowledge and
Q30: The figure shows inflation from 2009 to
Q31: The figure shows inflation from 2009 to
Q32: The figure shows inflation from 2009 to
Q34: The figure shows inflation expectations and actual
Q35: When output exceeds potential output:
(i) there is
Q36: When output is less than potential output:
(i)
Q37: If expected inflation is 3% and actual
Q38: If expected inflation is 2%, and actual
Unlock this Answer For Free Now!
View this answer and more for free by performing one of the following actions

Scan the QR code to install the App and get 2 free unlocks

Unlock quizzes for free by uploading documents