The figure shows inflation expectations and actual inflation for U.S. consumers over time. Which of the following statements correctly describes the relationship between these rates?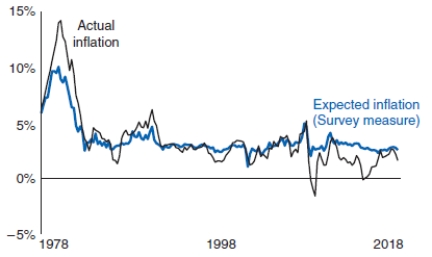
A) Actual inflation and inflation expectations seem to behave independently.
B) Actual inflation and inflation expectations are exactly the same over time.
C) Actual inflation tends to follow inflation expectations.
D) Actual inflation and inflation expectations have an inverse relationship.
Correct Answer:
Verified
Q29: If managers use strong macroeconomic knowledge and
Q30: The figure shows inflation from 2009 to
Q31: The figure shows inflation from 2009 to
Q32: The figure shows inflation from 2009 to
Q33: The figure shows inflation expectations for U.S.
Q35: When output exceeds potential output:
(i) there is
Q36: When output is less than potential output:
(i)
Q37: If expected inflation is 3% and actual
Q38: If expected inflation is 2%, and actual
Q39: If expected inflation is 1.75% and actual
Unlock this Answer For Free Now!
View this answer and more for free by performing one of the following actions

Scan the QR code to install the App and get 2 free unlocks

Unlock quizzes for free by uploading documents