(Figure: Minimum Wage) Suppose a minimum wage of Canadian $17 is implemented in Ontario Province. Suppose the graph represents a small sector of the labor market in Ontario. Using the graph, answer the following questions:
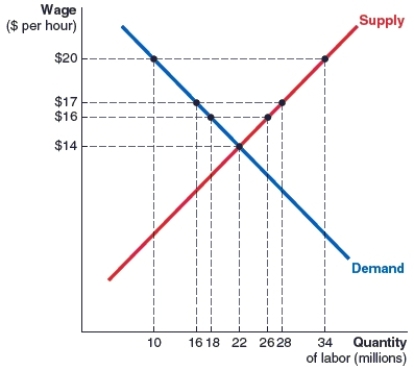 (a) What is the number of workers hired (in millions) after the implementation of the minimum wage of $17?
(b) After the implementation of the wage, the number of workers hired fell by _______ million workers
Correct Answer:
Verified
Q112: (Figure: Quota) Refer to the graph which
Q113: (Figure: Market for Logs) Suppose that the
Q114: (Figure: Price Ceiling) Refer to the graph.
Q115: (Figure: Price Floor) Refer to the graph.
Q116: (Figure: Minimum Wage) Suppose a minimum wage
Q118: (Figure: Market for Electric Vehicles) Refer to
Q119: Label each of the following below as
Q120: Label each of the following below as
Q121: Fill in the blanks below using either
Q122: Suppose the government imposes a $23 tax
Unlock this Answer For Free Now!
View this answer and more for free by performing one of the following actions

Scan the QR code to install the App and get 2 free unlocks

Unlock quizzes for free by uploading documents