(Figure: Quota) Refer to the graph which shows a quota at 40 units. Using the graph answer the following questions:
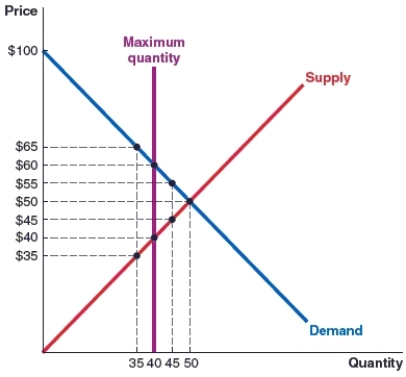 (a) The quota lowers the equilibrium quantity in the market by _____ units.
(b) After the implementation of the quota, what is the price that each buyer is willing to pay for each unit of the item?
(c) What is the price sellers are willing to accept (per unit) in order to supply 40 units?
Correct Answer:
Verified
Q107: (Figure: Tax on Buyer) Refer to the
Q108: Fill in the blanks below using one
Q109: (Figure: Sugar Market) Refer to the graph
Q110: The table shows the market for
Q111: The table shows market data for
Q113: (Figure: Market for Logs) Suppose that the
Q114: (Figure: Price Ceiling) Refer to the graph.
Q115: (Figure: Price Floor) Refer to the graph.
Q116: (Figure: Minimum Wage) Suppose a minimum wage
Q117: (Figure: Minimum Wage) Suppose a minimum wage
Unlock this Answer For Free Now!
View this answer and more for free by performing one of the following actions

Scan the QR code to install the App and get 2 free unlocks

Unlock quizzes for free by uploading documents