(Figure: Price Floor) Refer to the graph. Assume a price floor is implemented at $35. Using the graph answer the following questions:
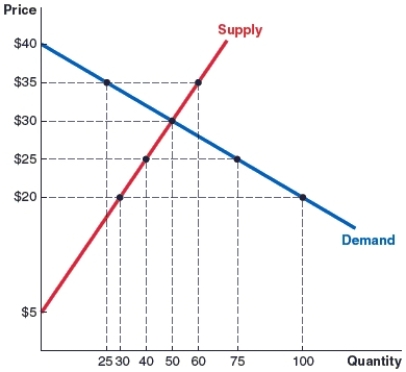 (a) How many units are buyers willing to buy after the institution of the price floor?
(b) How many units are sellers willing to sell after the institution of the price floor?
(c) After the institution of the price floor, how many units are actually sold in this market?
(d) Does the price floor cause a shortage or a surplus? How many units is this shortage or surplus?
Correct Answer:
Verified
Q110: The table shows the market for
Q111: The table shows market data for
Q112: (Figure: Quota) Refer to the graph which
Q113: (Figure: Market for Logs) Suppose that the
Q114: (Figure: Price Ceiling) Refer to the graph.
Q116: (Figure: Minimum Wage) Suppose a minimum wage
Q117: (Figure: Minimum Wage) Suppose a minimum wage
Q118: (Figure: Market for Electric Vehicles) Refer to
Q119: Label each of the following below as
Q120: Label each of the following below as
Unlock this Answer For Free Now!
View this answer and more for free by performing one of the following actions

Scan the QR code to install the App and get 2 free unlocks

Unlock quizzes for free by uploading documents