Scenario: The table below lists the willingness to pay for ten potential buyers of a Walter Payton rookie card and the willingness to accept for ten potential sellers of the card. (Walter Payton was a running back for the NFL's Chicago Bears from 1985 to 1987 and was elected into the NFL's Hall of Fame in 1993.) The graph below the table can be used to display the demand and supply schedules.
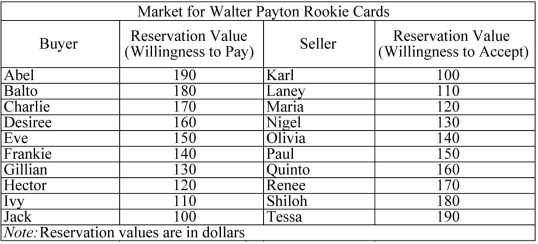
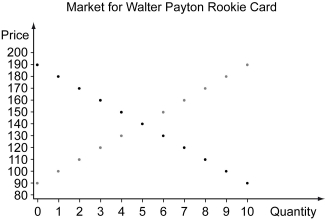
-Refer to the scenario above.In the graph above,plot the market demand schedule from the willingness to pay of buyers,and graph the market supply schedule from the willingness to accept of sellers.(Hint: Use the stairstep method similar to Exhibits 7.2 and 7.3 in the textbook; over and down for drawing market demand,and up and over for drawing market supply.)
Correct Answer:
Verified
View Answer
Unlock this answer now
Get Access to more Verified Answers free of charge
Q52: The following table displays the reservation values
Q53: Scenario: The table below lists the willingness
Q54: Scenario: The table below lists the willingness
Q55: The following figure illustrates the demand and
Q56: The following figure shows the demand and
Q58: The social surplus in a market is
Q59: The tables below show reservation values of
Q60: The following figure illustrates the demand and
Q61: The following graph shows the marginal cost
Q62: Take a deck of playing cards and
Unlock this Answer For Free Now!
View this answer and more for free by performing one of the following actions

Scan the QR code to install the App and get 2 free unlocks

Unlock quizzes for free by uploading documents