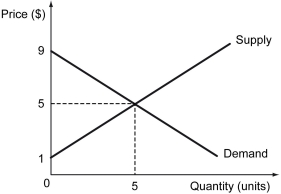
The following figure shows the demand and supply of a good.Calculate the social surplus using this figure.What is the maximum possible social surplus in this market?
Correct Answer:
Verified
View Answer
Unlock this answer now
Get Access to more Verified Answers free of charge
Q51: The following figure illustrates the demand and
Q52: The following table displays the reservation values
Q53: Scenario: The table below lists the willingness
Q54: Scenario: The table below lists the willingness
Q55: The following figure illustrates the demand and
Q57: Scenario: The table below lists the willingness
Q58: The social surplus in a market is
Q59: The tables below show reservation values of
Q60: The following figure illustrates the demand and
Q61: The following graph shows the marginal cost
Unlock this Answer For Free Now!
View this answer and more for free by performing one of the following actions

Scan the QR code to install the App and get 2 free unlocks

Unlock quizzes for free by uploading documents