The following graph shows the marginal cost curves of two profit-maximizing firms in a perfectly competitive market.
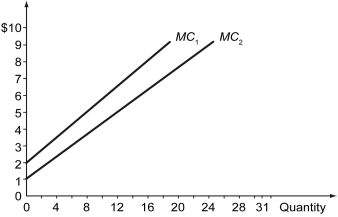
-Refer to the graph above.At the competitive equilibrium price in this market,Firm 1 produces ________ compared to Firm 2,and will get ________ in producer surplus.
A) more; more
B) more; less
C) less; more
D) less; less
Correct Answer:
Verified
Q56: The following figure shows the demand and
Q57: Scenario: The table below lists the willingness
Q58: The social surplus in a market is
Q59: The tables below show reservation values of
Q60: The following figure illustrates the demand and
Q62: Take a deck of playing cards and
Q63: If firms in a competitive industry independently
Q64: The following figure shows the marginal cost
Q65: The following figure shows the marginal cost
Q66: $100 is to be divided among two
Unlock this Answer For Free Now!
View this answer and more for free by performing one of the following actions

Scan the QR code to install the App and get 2 free unlocks

Unlock quizzes for free by uploading documents