The figure below shows the demand, supply, and marginal social benefit curves for Good Y.
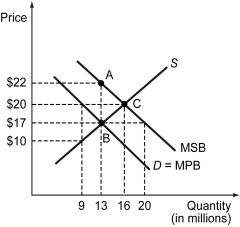
-Refer to the figure above.The MSB curve lies to the right of the demand curve because the production of Good Y involves ________.
A) positive externalities
B) negative externalities
C) increasing returns to scale
D) decreasing returns to scale
Correct Answer:
Verified
Q23: The following figure shows the market supply
Q44: The figure below shows the demand, supply,
Q45: The figure below shows the demand, supply,
Q46: Which of the following is true if
Q47: If the production of a good involves
Q49: Which of the following results in a
Q50: The following figure shows the market supply
Q51: The marginal social benefit from the production
Q52: Which of the following activities is most
Q53: The production of a certain fertilizer emits
Unlock this Answer For Free Now!
View this answer and more for free by performing one of the following actions

Scan the QR code to install the App and get 2 free unlocks

Unlock quizzes for free by uploading documents