The figure below shows the demand, supply, and marginal social benefit curves for Good Y.
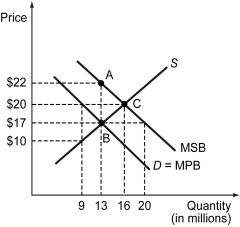
-Refer to the figure above.How many units of Good Y will be supplied when the market is free?
A) 9 million
B) 16 million
C) 13 million
D) 20 million
Correct Answer:
Verified
Q23: The following figure shows the market supply
Q39: If there are costly negative externalities associated
Q40: Suppose only dues-paying members of a private
Q41: The local community of the town of
Q42: The presence of a positive externality in
Q45: The figure below shows the demand, supply,
Q46: Which of the following is true if
Q47: If the production of a good involves
Q48: The figure below shows the demand, supply,
Q49: Which of the following results in a
Unlock this Answer For Free Now!
View this answer and more for free by performing one of the following actions

Scan the QR code to install the App and get 2 free unlocks

Unlock quizzes for free by uploading documents