The figure below shows the demand, supply, and marginal social benefit curves for Good Y.
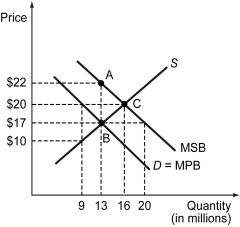
-Refer to the figure above.Social surplus can be increased by ________.
A) increasing output above 13 million units
B) reducing output below 13 million units
C) charging a price of $10
D) charging a price of $22
Correct Answer:
Verified
Q23: The following figure shows the market supply
Q40: Suppose only dues-paying members of a private
Q41: The local community of the town of
Q42: The presence of a positive externality in
Q44: The figure below shows the demand, supply,
Q46: Which of the following is true if
Q47: If the production of a good involves
Q48: The figure below shows the demand, supply,
Q49: Which of the following results in a
Q50: The following figure shows the market supply
Unlock this Answer For Free Now!
View this answer and more for free by performing one of the following actions

Scan the QR code to install the App and get 2 free unlocks

Unlock quizzes for free by uploading documents