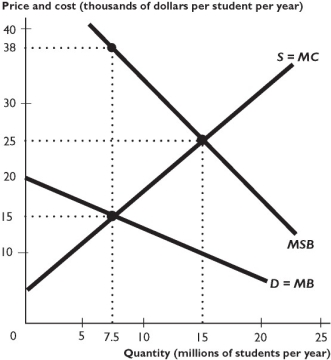
The figure above shows the demand for college education (D) , the marginal social benefit of college education (MSB) , and the marginal cost of the private schools (MC) .
-the figure above shows that the unregulated market equilibrium occurs at a tuition of ________ a year and ________ million students.
A) $15,000; 7.5
B) $25,000; 15
C) $15,000; 15
D) $25,000; 7.5
E) $38,000; 7.5
Correct Answer:
Verified
Q232: Q241: Externalities Q245: Q246: In a market with an external cost,government Q251: Q252: A noisy party that keeps neighbors awake Q255: When property rights are assigned and transactions Unlock this Answer For Free Now! View this answer and more for free by performing one of the following actions Scan the QR code to install the App and get 2 free unlocks Unlock quizzes for free by uploading documents![]()
A) are important in the areas of![]()
![]()

