Wally's Window Emporium is a leading producer and provider of residential windows across the United States. They just completed their second year of operations and compiled the following data: 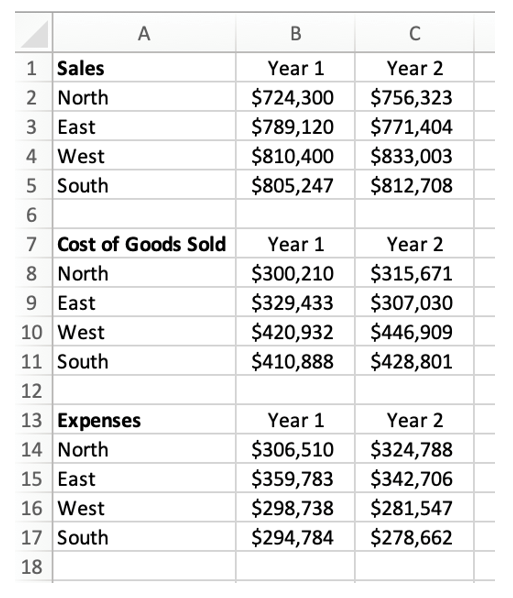 Management feels overwhelmed when they look at the data in this format, and they do not feel comfortable making decisions for the upcoming year until the data is easier to understand. The analytics team needs to present this information in a more user-friendly fashion so management can make data-informed decisions. With this information in mind, please answer the following questions.
a. What was the Gross Profit Percentage for each region for Year 2? What was the Net Income Percentage for each region for Year 2? (Round your answers to two decimal places.)
b. Which region had the largest percentage increase between years for Sales, Cost of Goods Sold (COGS), and Expenses? (Round your answers to two decimal places.)
c. What kind of graph would be most useful to display a comparison of net incomes for each region for Year 2? Create this graph.
Correct Answer:
Verified
North = 58....
View Answer
Unlock this answer now
Get Access to more Verified Answers free of charge
Q130: Tara is a cost accountant for Jameson's
Q131: Samantha is a Human Resource Associate for
Q132: Phoebe started her first job out of
Q133: Larry is the owner and operator of
Q134: Jeweltopia is a trendy online jewelry boutique
Q136: Wally's Window Emporium is a leading producer
Q137: Chocolate Delights Company manufactures gourmet chocolate candy
Q138: Chocolate Delights Company manufactures gourmet chocolate candy
Q139: Starling Corporation completed their fifth year of
Q140: Simon recently completed the third year of
Unlock this Answer For Free Now!
View this answer and more for free by performing one of the following actions

Scan the QR code to install the App and get 2 free unlocks

Unlock quizzes for free by uploading documents