Samantha is a Human Resource Associate for a small factory, and management asked her department to evaluate current wage trends. Ultimately, management has expressed concerns about the turnover the factory experienced over the past couple of years, and they hope to use analytics to determine possible causes. The company experienced a lot of turnover that has caused a lot of change in the rates paid to different hourly workers. The accounting department gathered the following data about 10 factory workers employed during the two-year period: 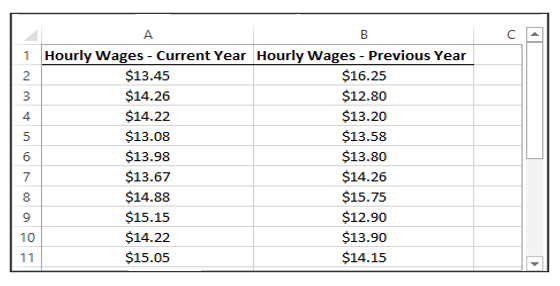 Samantha needs to use data analytics to assist in the investigation into possible causes for this turnover. With this information in mind, please answer the following questions. Use Excel or a similar spreadsheet program as appropriate.
a. Samantha would like to determine what the average hourly wage is. Using horizontal analysis, what is the percent change in the average hourly wage between this year and last year?
b. Samantha determines the market average wage rate for similar positions is $14.54 per hour. According to the data used in part a), is the factory competitive? What course of action could management take to ensure they either become or remain competitive?
c. Samantha would like to create a visual depiction of the average wages for the current and previous year compared to the average wages mentioned in b). Create an appropriate graph or visual, and explain why you selected that type of graph or visual.
Correct Answer:
Verified
View Answer
Unlock this answer now
Get Access to more Verified Answers free of charge
Q126: With the advent of analytical technology, organizations
Q127: Data analytics serve a number of purposes
Q128: Being career-ready has become a major objective
Q129: Artemis Inc. is a major producer of
Q130: Tara is a cost accountant for Jameson's
Q132: Phoebe started her first job out of
Q133: Larry is the owner and operator of
Q134: Jeweltopia is a trendy online jewelry boutique
Q135: Wally's Window Emporium is a leading producer
Q136: Wally's Window Emporium is a leading producer
Unlock this Answer For Free Now!
View this answer and more for free by performing one of the following actions

Scan the QR code to install the App and get 2 free unlocks

Unlock quizzes for free by uploading documents