Larry is the owner and operator of Larry's Pool Services, and he is performing his yearly financial review for the past year. The first step in the process is to look at his sales performance before evaluating any other metrics. 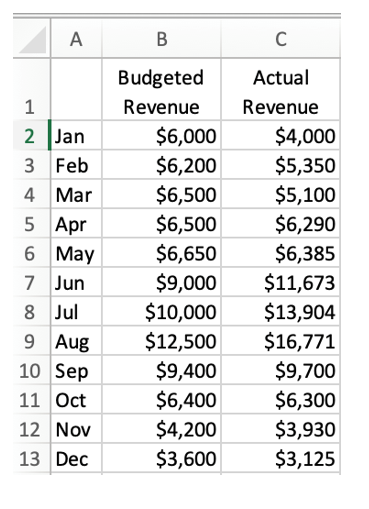 Larry decided to use data analytics for the first time. He recently took a course covering basic data analytics and how to apply the methodologies. With all of this in mind, please answer the following questions.
a. Larry believes a pie chart will best display his data for evaluation. Do you agree with this assessment? Why or why not? If you disagree, then please explain what graph you would recommend.
b. Using Excel or a similar spreadsheet program, create the graph from part a). What observations can you make looking at this graph?
c. Based upon your assessment from part b), what recommendations would you have for Larry for next year? Do you believe Larry has done an efficient job of budgeting for his business? What reasons could explain the drastic changes in revenues from June - August?
Correct Answer:
Verified
View Answer
Unlock this answer now
Get Access to more Verified Answers free of charge
Q128: Being career-ready has become a major objective
Q129: Artemis Inc. is a major producer of
Q130: Tara is a cost accountant for Jameson's
Q131: Samantha is a Human Resource Associate for
Q132: Phoebe started her first job out of
Q134: Jeweltopia is a trendy online jewelry boutique
Q135: Wally's Window Emporium is a leading producer
Q136: Wally's Window Emporium is a leading producer
Q137: Chocolate Delights Company manufactures gourmet chocolate candy
Q138: Chocolate Delights Company manufactures gourmet chocolate candy
Unlock this Answer For Free Now!
View this answer and more for free by performing one of the following actions

Scan the QR code to install the App and get 2 free unlocks

Unlock quizzes for free by uploading documents