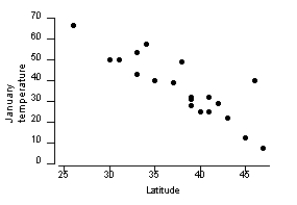
A scatterplot of geographic latitude (X) and average January temperature (Y) for 20 cities in the United States is given below. Is there a positive association or a negative association? Explain what such an association means in the context of this situation.
Correct Answer:
Verified
View Answer
Unlock this answer now
Get Access to more Verified Answers free of charge
Q7: Describe the type of association shown in
Q8: Describe the type of association shown in
Q9: Describe the type of association shown in
Q10: Which of the following sets of variables
Q11: Which of the following sets of variables
Q13: A scatterplot of y = height and
Q14: The following plot shows the association between
Q15: A car salesman is curious if he
Q16: In an attempt to model the relationship
Q17: Which graph shows a pattern that
Unlock this Answer For Free Now!
View this answer and more for free by performing one of the following actions

Scan the QR code to install the App and get 2 free unlocks

Unlock quizzes for free by uploading documents