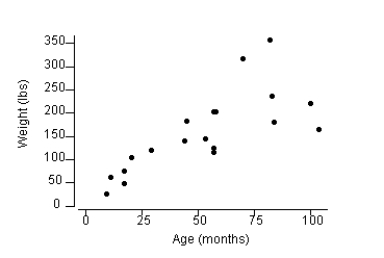
The following plot shows the association between weight (pounds) and age (months) for 19 female bears. Write an interpretation of this plot. Is the association negative or positive? Linear or curvilinear? Are there any outliers?
Correct Answer:
Verified
View Answer
Unlock this answer now
Get Access to more Verified Answers free of charge
Q9: Describe the type of association shown in
Q10: Which of the following sets of variables
Q11: Which of the following sets of variables
Q12: A scatterplot of geographic latitude (X) and
Q13: A scatterplot of y = height and
Q15: A car salesman is curious if he
Q16: In an attempt to model the relationship
Q17: Which graph shows a pattern that
Q18: Which of the following can not be
Q19: A regression line is a straight line
Unlock this Answer For Free Now!
View this answer and more for free by performing one of the following actions

Scan the QR code to install the App and get 2 free unlocks

Unlock quizzes for free by uploading documents