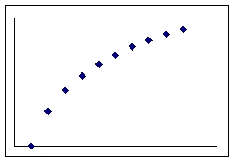
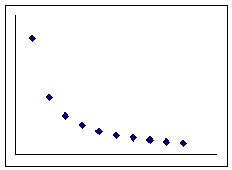
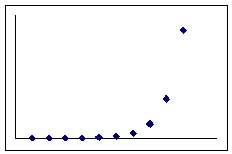
Which graph shows a pattern that would be appropriately described by the equation = + ?
A)
B)
C)
D)
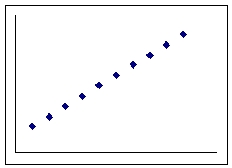
Correct Answer:
Verified
Q12: A scatterplot of geographic latitude (X) and
Q13: A scatterplot of y = height and
Q14: The following plot shows the association between
Q15: A car salesman is curious if he
Q16: In an attempt to model the relationship
Q18: Which of the following can not be
Q19: A regression line is a straight line
Q20: The equation of a regression line is
Q21: A regression line can be used to
Q22: A regression line can be used to
Unlock this Answer For Free Now!
View this answer and more for free by performing one of the following actions

Scan the QR code to install the App and get 2 free unlocks

Unlock quizzes for free by uploading documents