Table 16.1
The table below shows annual profit figures (in thousands of dollars) for a company.
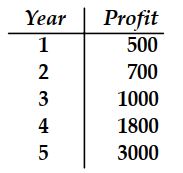
-Fit an exponential trend to the data in Table 16.1.
Correct Answer:
Verified
Q8: Given the regression equation
Q9: The symbol that represents the true
Q10: The width of a confidence interval
Q11: The advertising expense and profit of
Q12: A personnel manager wants to predict the
Q14: Table 16.1
The table below shows annual profit
Q15: The following data gives the demand of
Q16: Table 16.2
The data gives the number
Q17: Table 16.3
A study is supposed to
Q18: Using a 95% confidence level, construct
Unlock this Answer For Free Now!
View this answer and more for free by performing one of the following actions

Scan the QR code to install the App and get 2 free unlocks

Unlock quizzes for free by uploading documents