The following data gives the demand of a product (in hundreds of units) for five different price levels (in dollars):
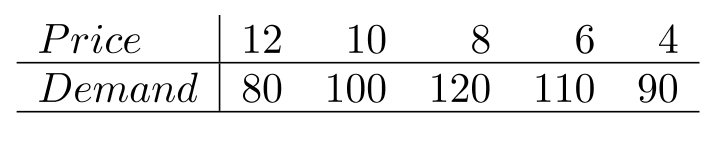 Fit a parabola to this data.
Correct Answer:
Verified
Q10: The width of a confidence interval
Q11: The advertising expense and profit of
Q12: A personnel manager wants to predict the
Q13: Table 16.1
The table below shows annual profit
Q14: Table 16.1
The table below shows annual profit
Q16: Table 16.2
The data gives the number
Q17: Table 16.3
A study is supposed to
Q18: Using a 95% confidence level, construct
Q19: Using a Q20: The estimated regression line is the line
Unlock this Answer For Free Now!
View this answer and more for free by performing one of the following actions

Scan the QR code to install the App and get 2 free unlocks

Unlock quizzes for free by uploading documents