Table 16.1
The table below shows annual profit figures (in thousands of dollars) for a company.
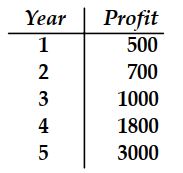
-Fit a power curve to the data in Table 16.1.
Correct Answer:
Verified
Q9: The symbol that represents the true
Q10: The width of a confidence interval
Q11: The advertising expense and profit of
Q12: A personnel manager wants to predict the
Q13: Table 16.1
The table below shows annual profit
Q15: The following data gives the demand of
Q16: Table 16.2
The data gives the number
Q17: Table 16.3
A study is supposed to
Q18: Using a 95% confidence level, construct
Q19: Using a
Unlock this Answer For Free Now!
View this answer and more for free by performing one of the following actions

Scan the QR code to install the App and get 2 free unlocks

Unlock quizzes for free by uploading documents