Multiple Choice

Figure 4-5
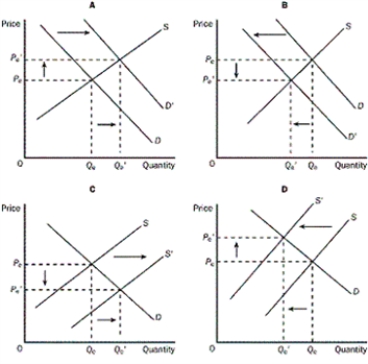
-Refer to the Figure 4-5.Which of the four graphs represents the market for cars after new technology was installed on assembly lines
A) graph A
B) graph B
C) graph C
D) graph D
Correct Answer:
Verified
Related Questions
Figure 4-5
-Refer to the Figure 4-5.Which of the four graphs represents the market for cars after new technology was installed on assembly lines
A) graph A
B) graph B
C) graph C
D) graph D
Correct Answer:
Verified

