Figure A below depicts the demand and supply of Japanese yen in the foreign currency exchange market. Figure B below depicts the aggregate supply-aggregate demand model for the Japanese economy. Use these figures to answer the next two questions:
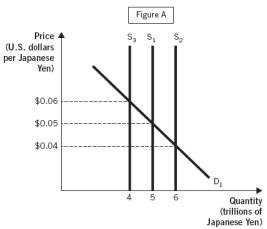
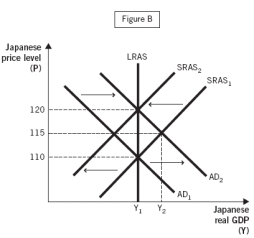
-Assume the Japanese economy is illustrated at the intersection of AD₁ and SRAS₁.If the Bank of Japan (the Japanese central bank) increased the supply of yen from five trillion to six trillion,the Japanese price level would ____________ in the short run and increase from 115 to 120 in the long run.
A) decrease from 120 to 110
B) not change
C) increase from 110 to 120
D) decrease from 120 to 115
E) increase from 110 to 115
Correct Answer:
Verified
Q41: A national government or central bank can
Q50: The arrows in Figures A-D represent possible
Q52: Figure A below depicts the demand and
Q57: The following two figures depict the demand
Q57: Figure A below depicts the demand and
Q60: The arrows in Figures A–D represent possible
Q120: The arrows in Figures A-D represent possible
Q124: The following figure depicts the demand for
Q134: The following two figures depict the demand
Q136: The following figure depicts the demand for
Unlock this Answer For Free Now!
View this answer and more for free by performing one of the following actions

Scan the QR code to install the App and get 2 free unlocks

Unlock quizzes for free by uploading documents