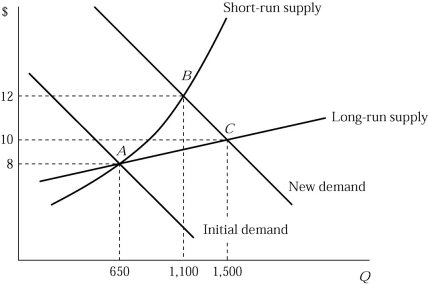
Solved

Figure 6.5 -Figure 6.5 Shows the Short-Run and Long-Run Effects of an of an Increase

Question 182

Multiple Choice

  Figure 6.5 -Figure 6.5 shows the short-run and long-run effects of an increase in demand of an industry with increasing cost. The market is in equilibrium at point A, where 100 identical firms produce 6 units of a product per hour. If the market demand curve shifts to the right, what will happen to an individual firm's profit? A)  Each firm earns a positive profit at point B. B)  Each firm earns a zero profit at point B because the market is perfectly competitive. C)  The profit of each firm decreases as more firms enter the market and share the benefits of an increase in demand pushing the market from point A to point B. D)  none of the above Figure 6.5
-Figure 6.5 shows the short-run and long-run effects of an increase in demand of an industry with increasing cost. The market is in equilibrium at point A, where 100 identical firms produce 6 units of a product per hour. If the market demand curve shifts to the right, what will happen to an individual firm's profit?


A) Each firm earns a positive profit at point B.
B) Each firm earns a zero profit at point B because the market is perfectly competitive.
C) The profit of each firm decreases as more firms enter the market and share the benefits of an increase in demand pushing the market from point A to point B.
D) none of the above

Correct Answer:

verifed

Verified

Unlock this answer now
Get Access to more Verified Answers free of charge

Related Questions

Unlock this Answer For Free Now!

View this answer and more for free by performing one of the following actions

qr-code

Scan the QR code to install the App and get 2 free unlocks

upload documents

Unlock quizzes for free by uploading documents