Multiple Choice
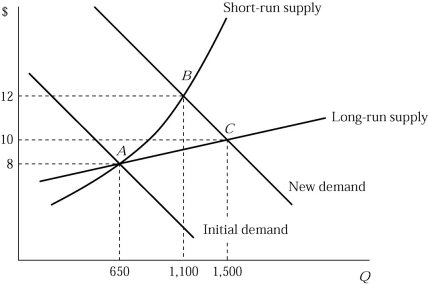 Figure 6.5
-Figure 6.5 shows the short-run and long-run effects of an increase in demand of an industry. The market is in equilibrium at point A, where 100 identical firms produce 6 units of a product per hour. If the market demand curve shifts to the right, what has happened to an individual firm's output level at point B?
A) Each firm produces two more units per hour.
B) Each firm produces relatively smaller level of output as more firms enter the market.
C) Each firm will produce the same level of output.
D) none of the above
Correct Answer:
Verified
Related Questions

