 Figure 6.5
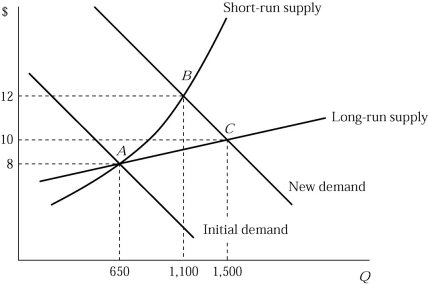
-Figure 6.5 shows the short-run and long-run effects of an increase in demand of an industry. The market is in equilibrium at point A, where 100 identical firms produce 6 units of a product per hour. If the market demand curve shifts to the right, which of the following statements is TRUE in the short run?
A) The market price rises to $12, which is greater than the average total cost.
B) Each existing firm maximizes its profit by producing the output where marginal cost equals $12.
C) Each existing firm produces two more units per hour, compared to its initial profit maximizing output level at point A.
D) all of the above
Correct Answer:
Verified
Q180: If the demand for a product in
Q181: Q182: Q183: Q184: Q187: If perfectly competitive firms are earning positive Q188: Recall the Application about the price and Q189: Recall the Application about the price and Q190: It is possible that a firm in Q195: Unlock this Answer For Free Now! View this answer and more for free by performing one of the following actions Scan the QR code to install the App and get 2 free unlocks Unlock quizzes for free by uploading documents![]()
![]()
![]()
![]()
![]()

