The figure below shows the demand (D) and supply (S) curves of corn syrups.Figure 21.3
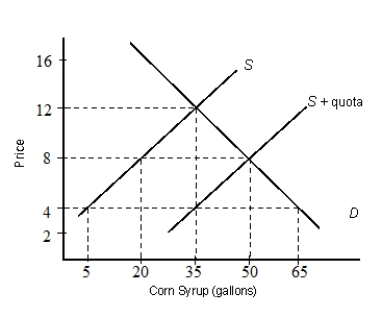
-The effect of an import quota on the domestic market is to shift the:
A) demand curve to the right by the amount of the quota.
B) demand curve to the left by the amount of the quota.
C) supply curve to the right by the amount of the quota.
D) supply curve to the left by the amount of the quota.
E) consumers' marginal utility curves if they prefer foreign goods to domestic goods.
Correct Answer:
Verified
Q51: The figure below shows the demand (D)
Q52: The figure below shows the demand (D)
Q53: The figure given below depicts the negatively
Q54: The figure given below depicts the negatively
Q55: The figure below shows the demand (D)
Q57: The figure below shows the demand (D)
Q58: The figure given below depicts the negatively
Q59: The figure given below depicts the negatively
Q60: The figure given below depicts the negatively
Q61: The figure below shows the demand (D)
Unlock this Answer For Free Now!
View this answer and more for free by performing one of the following actions

Scan the QR code to install the App and get 2 free unlocks

Unlock quizzes for free by uploading documents