The following figures show the demand and supply of labor in two different types of labor market. Figure 15.5 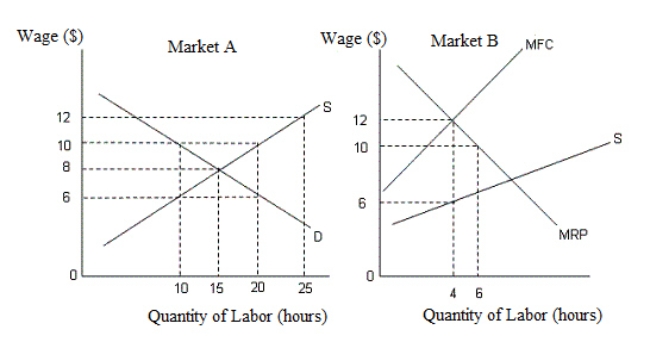 In the figures,
D: Demand curve for labor
S: Supply curve of labor
MRP: Marginal revenue product
MFC: Marginal factor cost
-In Figure 15.5,the equilibrium wage rate and the level of employment in Market A are _____ and _____ respectively.
A) $8; 15 hours.
B) $10; 10 hours.
C) $10; 20 hours.
D) $12; 25 hours.
E) $6; 20 hours.
Correct Answer:
Verified
Q45: The figure given below shows the income-leisure
Q45: The figure given below shows the income-leisure
Q46: The figure given below shows the income-leisure
Q48: The figure given below shows the income-leisure
Q48: The following figures show the demand and
Q49: The figure given below shows the income-leisure
Q50: The figure given below shows the income-leisure
Q51: The following figures show the demand and
Q56: The figure given below shows the demand
Q59: The figure given below shows the income-leisure
Unlock this Answer For Free Now!
View this answer and more for free by performing one of the following actions

Scan the QR code to install the App and get 2 free unlocks

Unlock quizzes for free by uploading documents